
In the ever-evolving landscape of software development and operations, ensuring the reliability, performance, and availability of applications is paramount. To meet these demands, DevOps teams are increasingly turning to Full Stack Observability, a practice that provides deep insights into the entire software stack, from infrastructure to application, in real-time. Two essential tools in the Full Stack Observability arsenal are Prometheus and Grafana.
Prometheus: The Beacon Of Metrics Monitoring

Prometheus, an open-source systems monitoring and alerting toolkit, is at the forefront of the Full Stack Observability revolution. Originally developed by SoundCloud, this project is now part of the Cloud Native Computing Foundation (CNCF), a testament to its robustness and versatility.
Key Properties Of Prometheus
- Multidimensional Data Model
Prometheus employs a multi-dimensional data model to store time-series data efficiently. It stores metrics as key-value pairs, making it easy to identify and query data based on multiple dimensions like application, service, and environment.
- Powerful Query Language
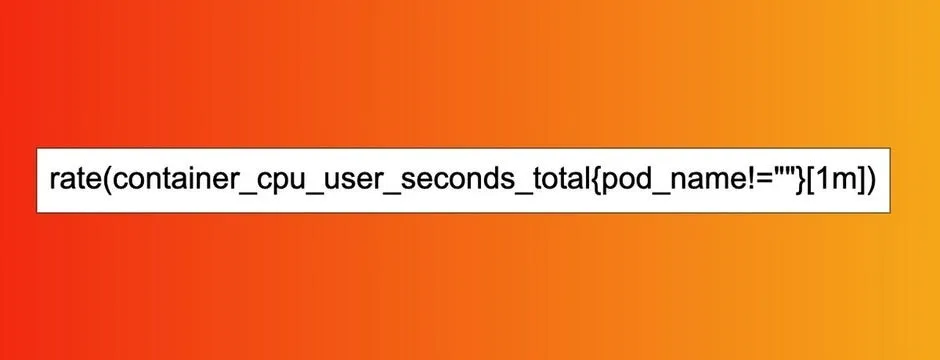
Prometheus Query Language (PromQL) allows users to perform complex queries on collected metrics. It’s designed for flexibility and is particularly adept at identifying anomalies and patterns in data.
- Scalability And Reliability
Prometheus is designed for scalability. Its architecture allows you to scale up as your needs grow. Additionally, its pull-based model ensures reliability, even in dynamic environments.
- Alerting and Notifications
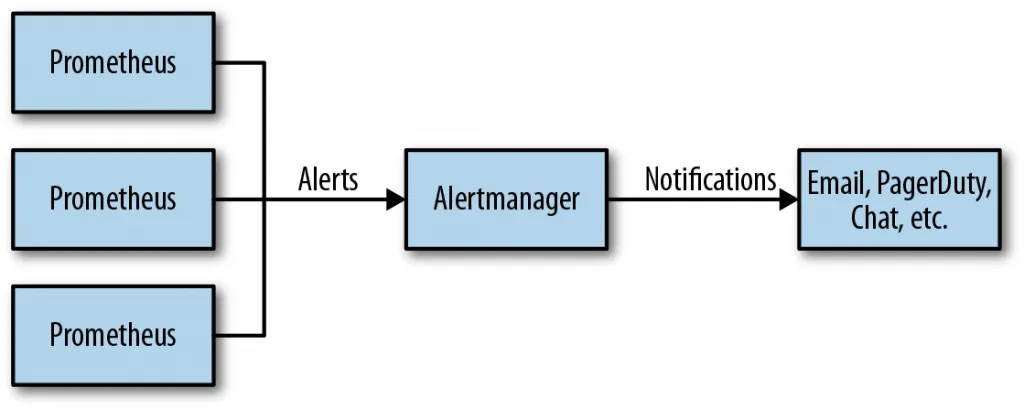
Prometheus comes equipped with a robust alerting system. It can trigger alerts based on predefined rules and send notifications via various channels, ensuring that you stay informed about issues in real-time.
Prometheus In Action
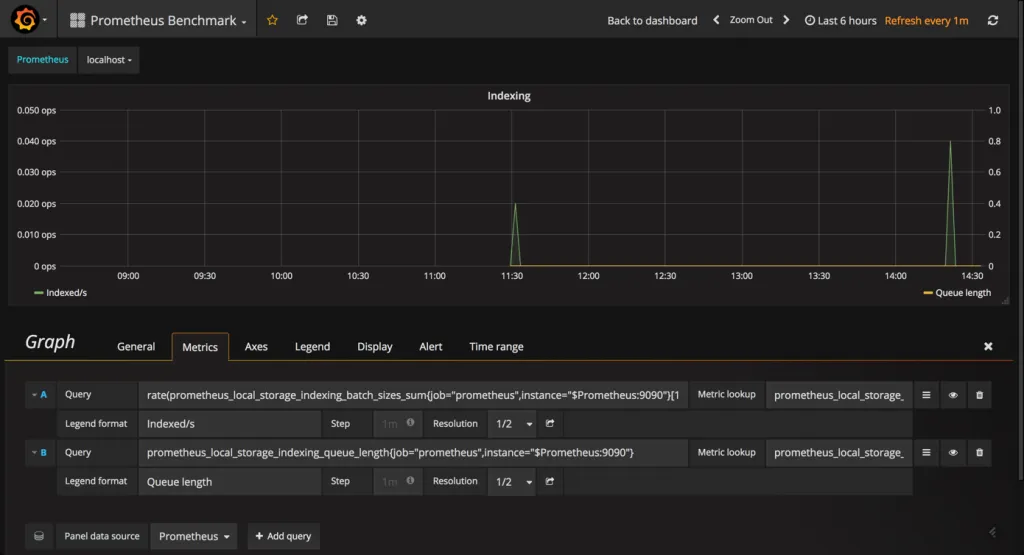
Prometheus excels at collecting time-series data from various sources. It can scrape metrics from applications, services, and infrastructure components. By instrumenting your code and systems, you can expose crucial performance and health metrics. Prometheus then collects, stores, and allows you to query and visualize this data.
Grafana: The Canvas Of Data Visualization

While Prometheus excels at collecting data, Grafana, an open-source platform for monitoring and observability, is all about visualization. Grafana provides the tools to transform raw data into meaningful insights through rich, interactive dashboards.
Key Properties Of Grafana
- Extensive Data Source Support
Grafana supports a wide range of data sources, including Prometheus, InfluxDB, Elasticsearch, and more. This flexibility enables you to centralize and visualize data from various systems in a single interface.
- Customizable Dashboards
Grafana’s dashboard builder is user-friendly and highly customizable. You can create dashboards tailored to your specific needs, combining metrics from multiple sources into a single view.
- Alerting And Annotations
Grafana’s alerting system allows you to set up alerts based on metric thresholds. Annotations let you overlay events and issues on your graphs, providing contextual information.
- Community-Driven
Grafana boasts a vibrant community that contributes to its ecosystem with plugins, templates, and extensions. This community-driven development ensures the availability of a wide range of features and integrations.
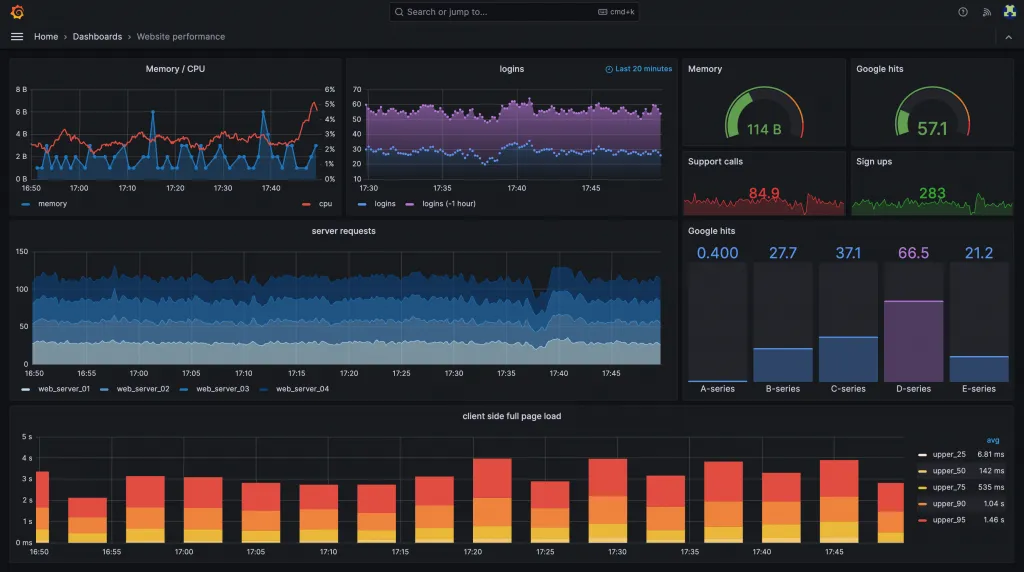
Grafana In Action
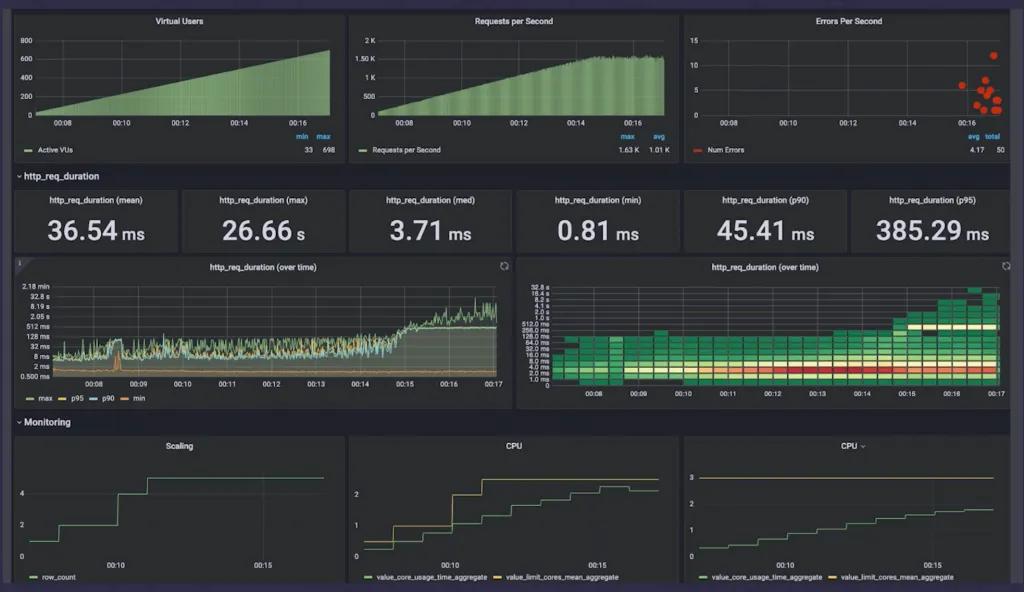
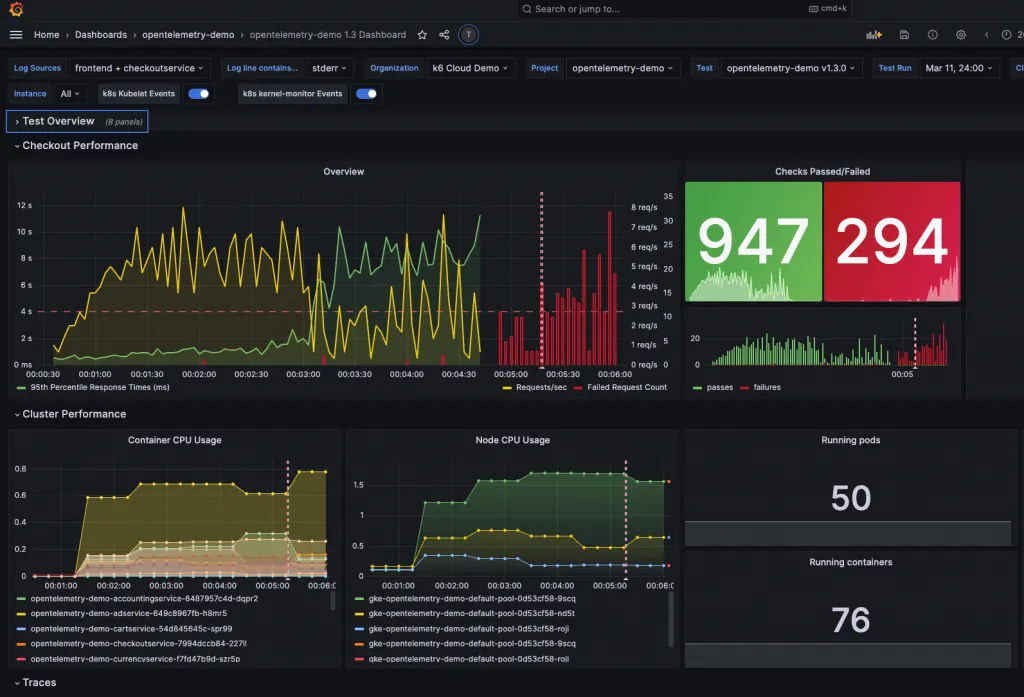
Grafana serves as the visualization layer in the Full Stack Observability pipeline. With Grafana, you can build comprehensive dashboards that display metrics collected by Prometheus. These dashboards offer a real-time view of your system’s health and performance, enabling you to identify trends, anomalies, and bottlenecks.
The Power Of Prometheus And Grafana In Tandem
While Prometheus excels at data collection, Grafana transforms this raw data into actionable insights. When used together, these tools form a formidable combination:
- Real-Time Monitoring And Visualization
Prometheus collects metrics in real-time, and Grafana provides real-time visualization. This combination allows you to spot issues as they occur and take immediate action.
- Rich Data Exploration
Prometheus’ query language (PromQL) and Grafana’s interactive dashboards enable rich data exploration. You can drill down into specific time ranges, filter by dimensions, and create ad-hoc queries.
- Comprehensive Alerting
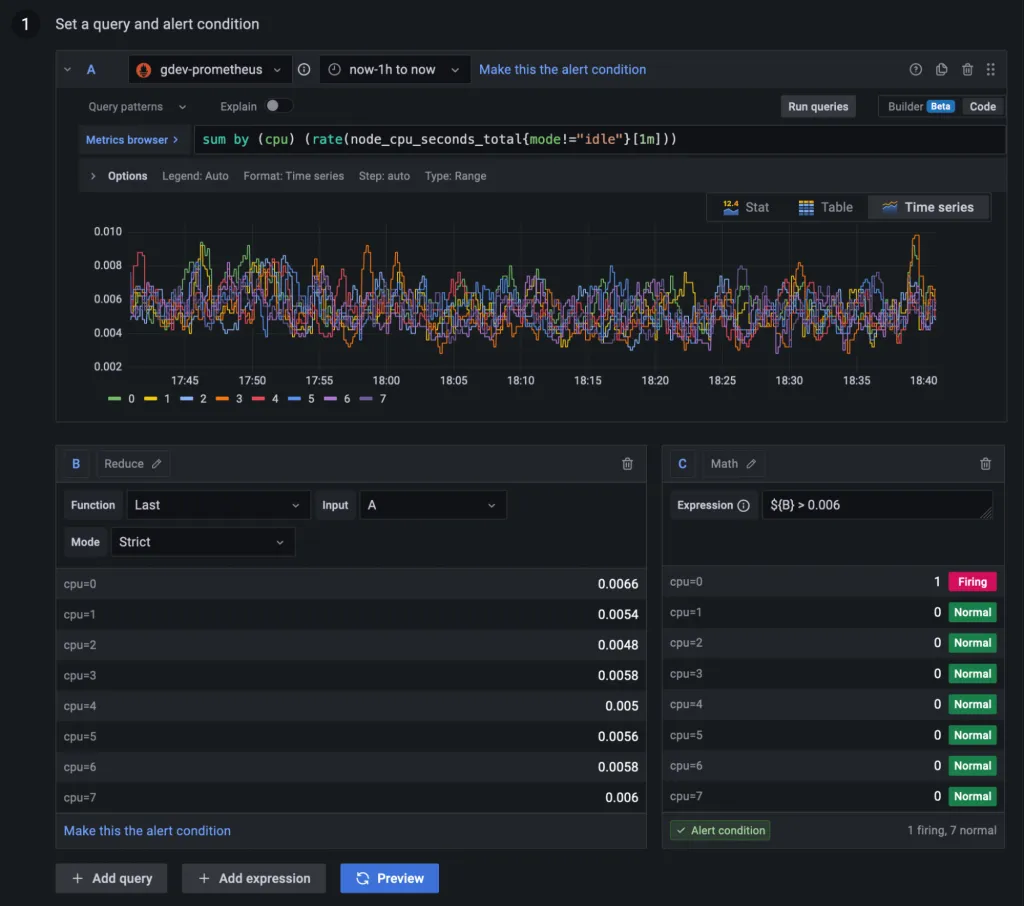
Prometheus’ alerting system can trigger alerts based on specific conditions, and Grafana can display these alerts on dashboards. This comprehensive alerting and visualization help you react swiftly to issues.
- Centralized Observability
With Prometheus and Grafana, you can centralize observability across your entire stack, from infrastructure to applications. This holistic view enhances your troubleshooting capabilities and streamlines incident response.
Enhancing DevOps Workflows With Prometheus And Grafana
Prometheus and Grafana align perfectly with the core tenets of DevOps: collaboration, automation, and a focus on end-to-end visibility.
When integrated into your DevOps workflows, these tools:
- Foster Collaboration: Prometheus and Grafana provide a common platform for development and operations teams to monitor and troubleshoot issues collaboratively.
- Automate Alerting: Prometheus’ alerting rules, combined with Grafana’s notifications, enable automated alerting, reducing the time between issue detection and resolution.
- Improve Incident Response: The real-time monitoring and visualization capabilities of Prometheus and Grafana enable quicker incident detection, investigation, and resolution.
- Enhance Performance: Full Stack Observability with Prometheus and Grafana helps identify performance bottlenecks and areas for optimization, leading to more efficient applications.
The Mission Of The InRhythm Propel Summit
The InRhythm Propel Summit embodies InRhythm’s commitment to nurturing a culture of continuous learning and growth. Its mission is simple but profound: to provide professionals with the skills, insights, and strategies they need to thrive in the ever-evolving technology landscape.
InRhythm believes that investing in education and professional development directly translates into better performance, innovation, and overall job satisfaction. By championing a culture of lifelong learning, the Summit aligns perfectly with InRhythm’s broader mission: to elevate engineering teams and equip them with the tools necessary to excel in today’s competitive markets.
Closing Thoughts
Prometheus and Grafana are essential tools for achieving Full Stack Observability and enhancing DevOps workflows. Prometheus excels at data collection and alerting, while Grafana provides rich visualization capabilities. Together, they empower DevOps teams to monitor, troubleshoot, and optimize their systems effectively. As part of the InRhythm Propel Summit, we champion these tools’ adoption as a means to support learning, growth, and innovation within engineering teams. By harnessing the power of Prometheus and Grafana, you can elevate your DevOps practices and achieve new heights of operational excellence.