
We recently held our Spring Summit consisting of six workshops hosted by each of our practice areas. On March 17th, 2023, our SDET Practice led a series of talks and workshops on Microsoft’s Playwright.
Playwright is a tool that enables end-to-end testing of modern web applications. Playwright works with all modern web browsers including: Chromium, Firefox, and WebKit.
Fixtures
Before we get into specific tools, let’s talk about Playwright Fixtures.
For those unfamiliar with test fixtures, these can be useful in establishing an environment for each test. That is, a fixture can provide everything a test needs to run. It is recommended that your fixtures provide only the absolutely necessary things to run and nothing else. In Playwright, fixtures are isolated between tests. With fixtures, you can group tests based on their meaning, instead of their common setup.
According to the official Playwright documentation (source: https://playwright.dev/docs/test-fixtures), Fixtures have a number of advantages over before/after hooks:
- Fixtures encapsulate setup and teardown in the same place so it is easier to write
- Fixtures are reusable between test files — you can define them once and use them in all your tests. That’s how Playwright’s built-in page fixture works
- Fixtures are on-demand — you can define as many fixtures as you’d like, and Playwright Test will setup only the ones needed by your test and nothing else
- Fixtures are composable — they can depend on each other to provide complex behaviors
- Fixtures are flexible. Tests can use any combination of the fixtures to tailor the precise environment they need, without affecting other tests
- Fixtures simplify grouping. You no longer need to wrap tests in describes that set up environment, and are free to group your tests by their meaning instead
Playwright Inspector
Playwright Inspector is the default debugging tool for Playwright. While Playwright scripts typically run in a headless mode, Playwright Inspector has a GUI to help troubleshoot your script which opens during the test run along with the browser that opens in headed mode.
To enable it we add a ` — debug` to our command line. You can specify which test to run by adding `-g “test name”`. See our example below:
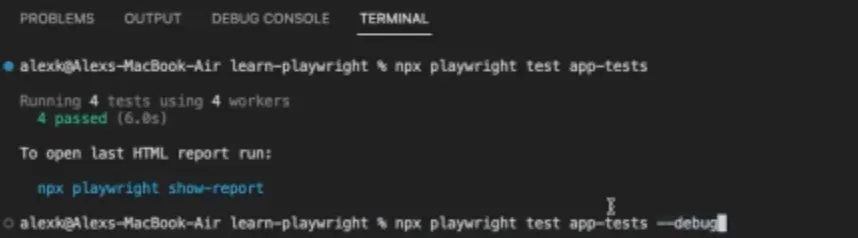
When you run tests in debug mode, VSCode will open up the Playwright Inspector window, which will show the code to be executed and the debugger, such as the image below:
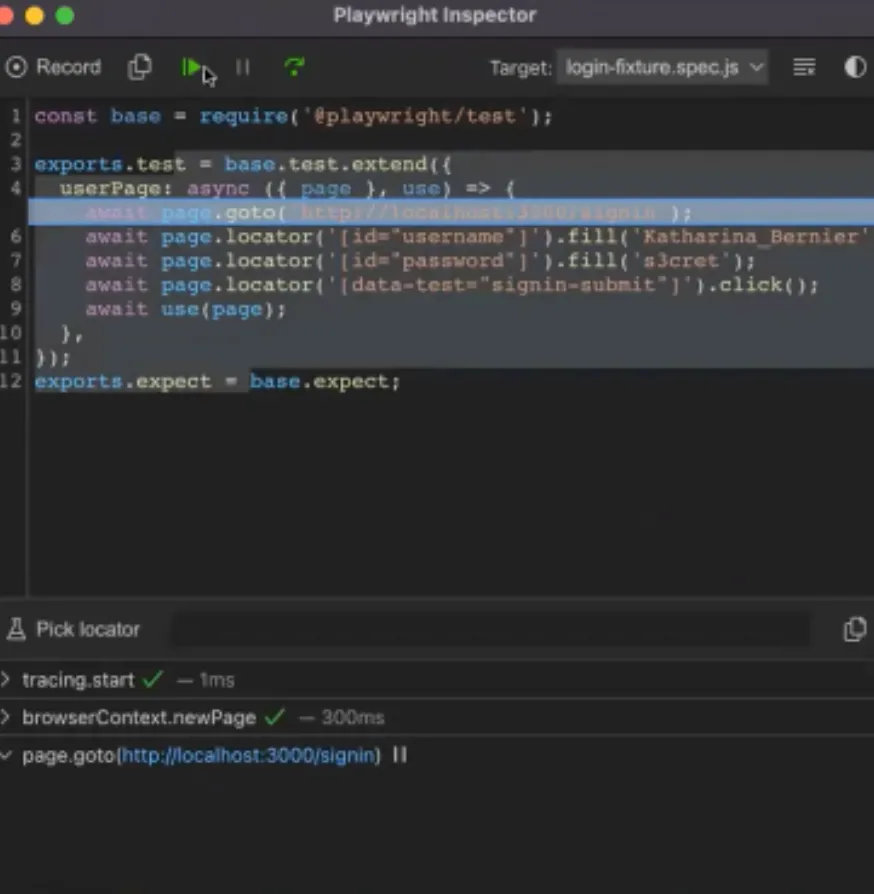
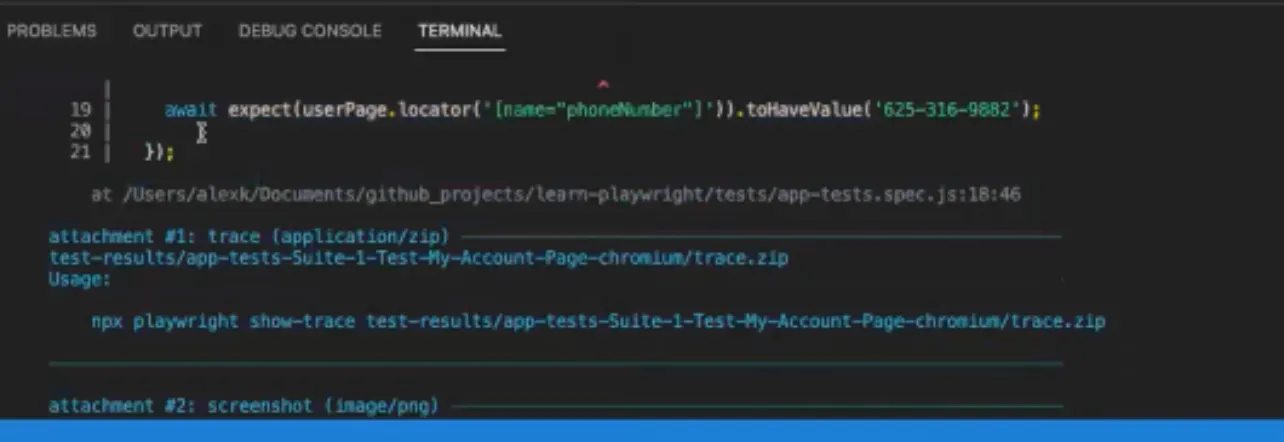
Once we have started our application with Playwright debugging on, we can step through the code in the Playwright Inspector and choose when to use our Fixtures for our tests. You can also let the tests play, and if it will stop at any part that breaks. From there you can look at the error report generated by Playwright. The error report can include lots of useful information such as timeouts, missing variables, unexpected results, etc. In addition to the report you can also view the results in the terminal from VSCode.
See below for an example:
With Playwright Inspector you can set breakpoints to help you debug., You may find it helpful to add a breakpoint on a line before the line you know is broken. Breakpoints should be set in code with the await page.pause() statement. This will give you the ability to look at current variables and settings before you get to the line you are attempting to diagnose. But where Inspector truly shines is helping you debug the web page document object model (DOM).
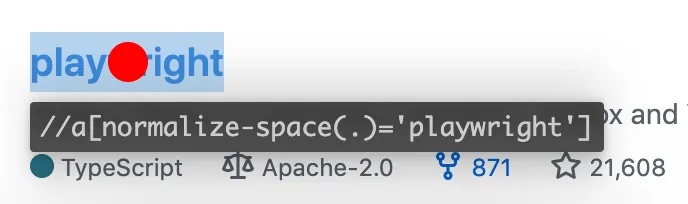
The browser console can be used to debug locators while running tests in debug with playwright inspector. A javascript ‘playwright’ object can be used to evaluate different locators while the test run stopped at a breakpoint. To test locators use ‘playwright’ object methods like: playwright.locator(“string-locator”) and playwright.inspect(“string-locator”).
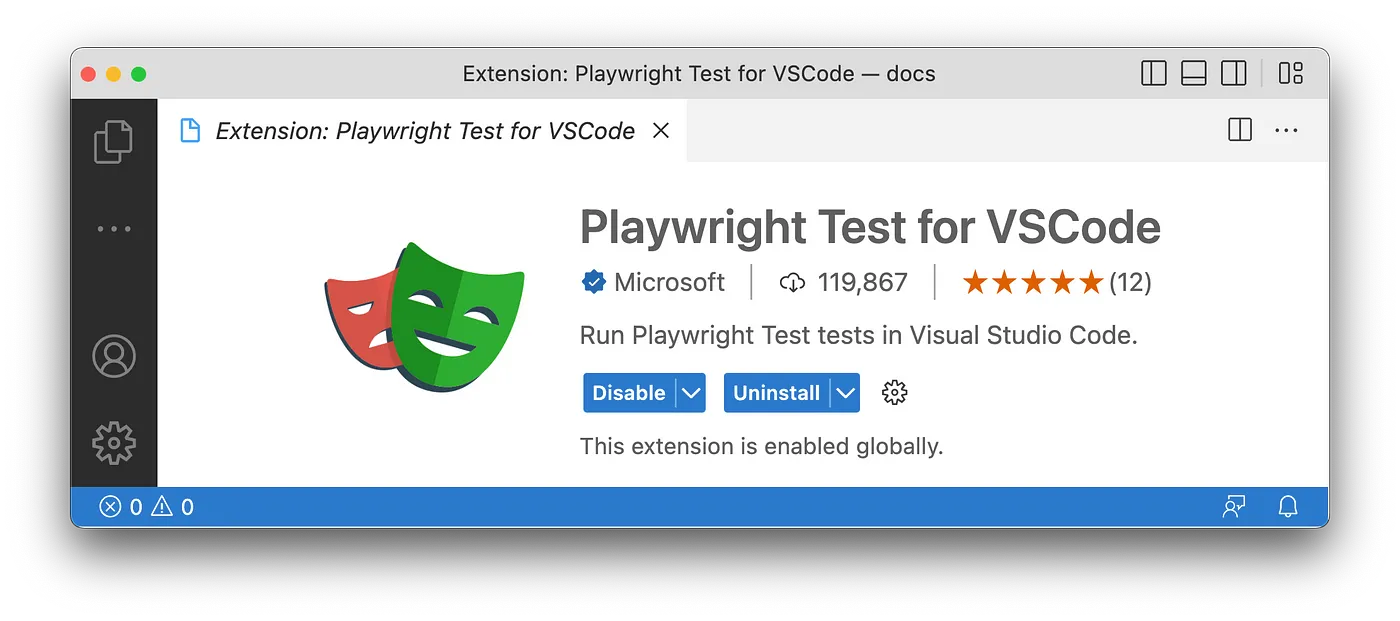
Playwright Test For VSCode
Playwright Test for VSCode is a plugin that helps you integrate Playwright into your VSCode workflow. According to Microsoft, this plugin can:
- Install Playwright
- Run Tests With A Single Click
- Run Multiple Tests
- Show Browsers
- Pick Locators
- Debug Step-By-Step, Explore Locators
- Tune Locators
- Record New Tests
- Record At Cursor
You can install this extension by clicking on the extension tab/button in VSCode, then search for “playwright.” Click on the one that says “Playwright Test for VSCode” by Microsoft.
Once installed it will scan your project for all of your tests and group them together. With this integrated into VSCode, a play button will now appear beside tests in your test files. This makes it much easier to start and debug than with Playwright Inspector where you need to use a command line.
Additionally this adds a Playwright panel to VSCode that makes it easier to toggle options such as should your test run in headless mode or not. In short, this plug-in adds in a lot of nice features designed to provide a better user experience for testers.
Trace Viewer
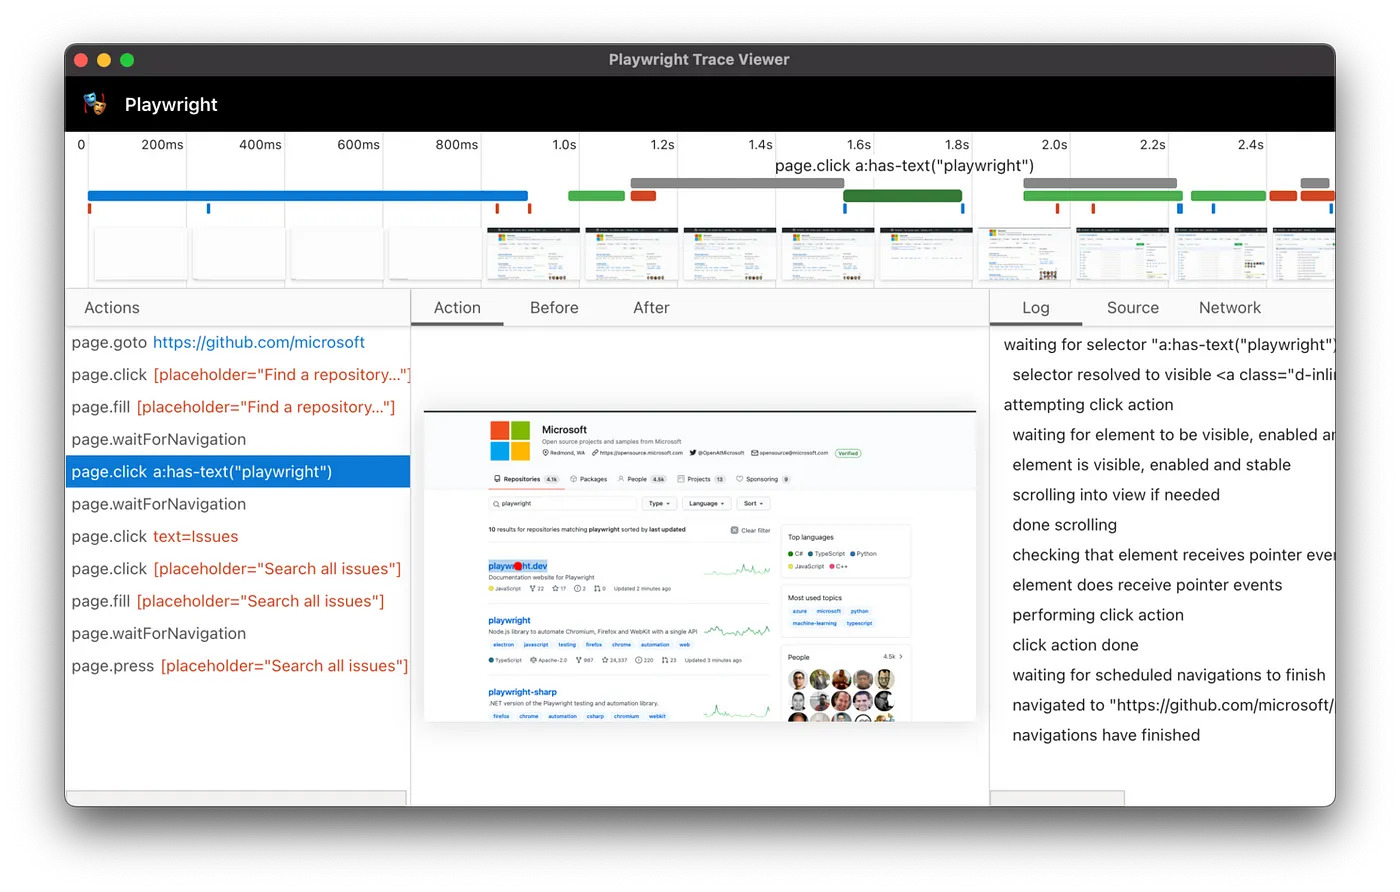
Finally we have a Trace Viewer. Playwright Trace Viewer is a GUI tool that helps you explore recorded Playwright traces after the script has run. You can open traces locally or in your browser on trace.playwright.dev.
There are a couple of ways to enable the trace viewer. First the command line, where you add the option, ` — trace on` or you can go to the Playwright settings file and enable (or disable) it there.
Results are stored in a trace folder. To open a trace via the command line you enter, `playwright show-trace <path-to-file>` and hit ENTER. The trace viewer provides you with a lot of detailed information such as page load times, calls to resources, and which Javascript functions are being called.
Closing Thoughts
In conclusion, though each of these tools has its pluses and minuses, utilizing a combination of all three can help you take your diagnostics to a whole new level.