Ensuring the reliability, performance, and security of your applications is paramount. Achieving these goals requires gaining deep insights into every layer of your technology stack, from infrastructure to application code. Full Stack Observability is the key, and Grafana is the Swiss Army knife that empowers engineers to unlock its potential.
Full Stack Observability: A Necessity For Modern Business
As businesses increasingly rely on technology to deliver products and services, the complexity of their software systems has grown exponentially. Microservices architectures, serverless computing, and containerization have introduced a multitude of interconnected components. Ensuring the seamless operation of these systems demands comprehensive observability.
What is Full Stack Observability?
Full Stack Observability is the practice of collecting, correlating, and analyzing data from all layers of your technology stack, including infrastructure, networks, applications, and user interactions. It goes beyond traditional monitoring by providing a holistic view of your system’s health, performance, and behavior.
- Infrastructure Monitoring: Track the health and performance of servers, databases, and networking components.
- Application Monitoring: Gain insights into application code, dependencies, and performance bottlenecks.
- User Experience Monitoring: Understand how users interact with your applications and identify areas for improvement.
- Logs and Traces: Collect logs, traces, and events to troubleshoot issues and gain visibility into system behavior.
What Is Grafana, And How Does It Benefit You?

Grafana is an open-source platform for monitoring and observability that has gained widespread adoption in the tech industry. It’s renowned for its flexibility, extensibility, and its ability to integrate seamlessly with a variety of data sources, including popular observability tools like Prometheus, InfluxDB, and Elasticsearch.
At its core, Grafana serves as a centralized dashboarding and visualization tool. It allows engineers to create customized dashboards that aggregate data from multiple sources. Whether you’re monitoring infrastructure, application performance, or user interactions, Grafana provides a single pane of glass for all your observability needs.
Grafana offers several key benefits:
- Flexibility: Grafana’s pluggable architecture means it can connect to virtually any data source, making it a versatile choice for engineers working with diverse tech stacks.
- Customization: Engineers can create dashboards tailored to their specific needs, visualizing data in ways that are most meaningful to them.
- Alerting: Grafana includes robust alerting capabilities, allowing teams to proactively respond to anomalies and outages.
- Community: With an active and passionate user community, Grafana enjoys a constant stream of updates, plugins, and integrations.
The Role Of Grafana In Full Stack Observability
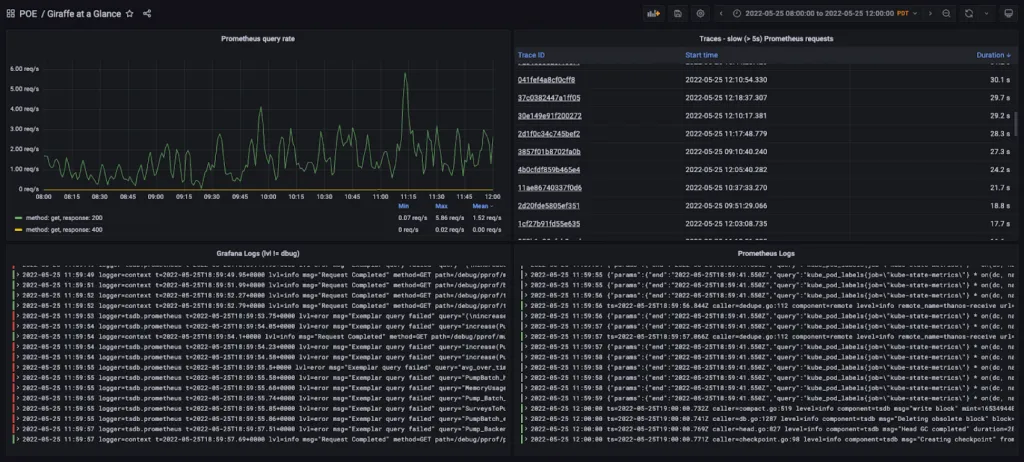
Grafana plays a pivotal role in achieving Full Stack Observability. It acts as the central hub where data from various sources is collected, correlated, and visualized. Here’s how it fits into the broader observability picture:
Data Aggregation
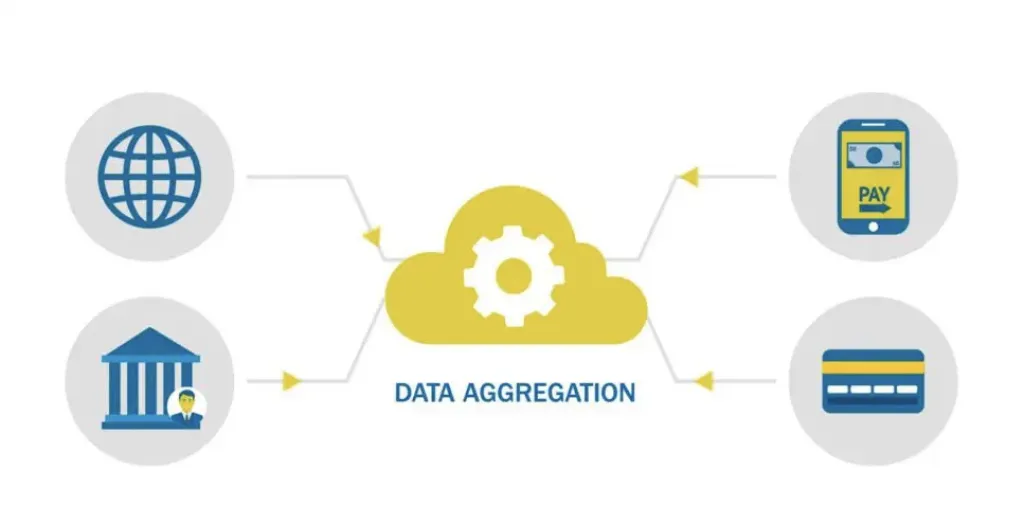
Grafana collects data from different sources across your technology stack, from infrastructure metrics to application performance data.
Visualization
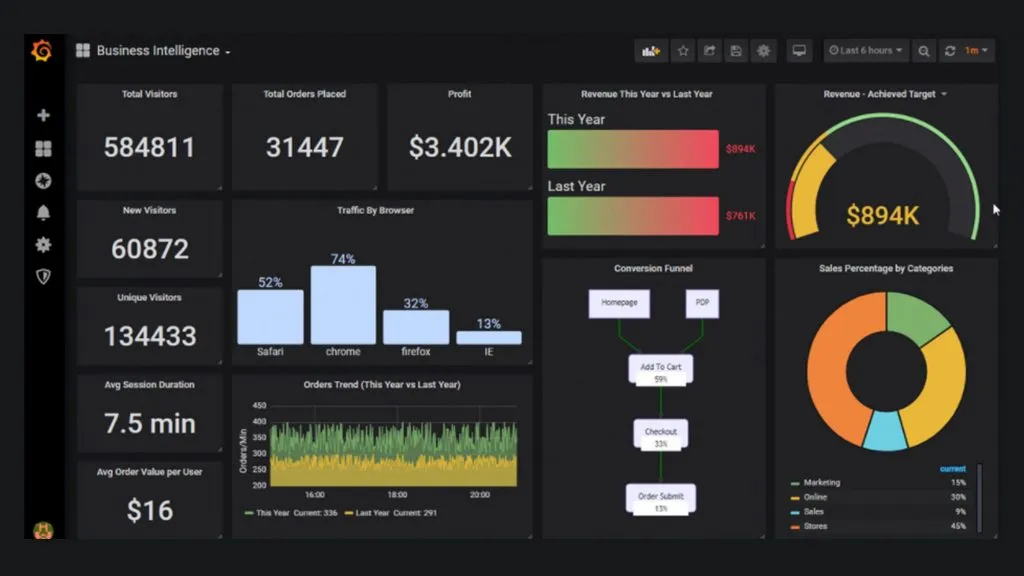
Engineers can create dashboards that provide real-time insights into system behavior, allowing them to identify issues, track performance trends, and make informed decisions.
Alerting
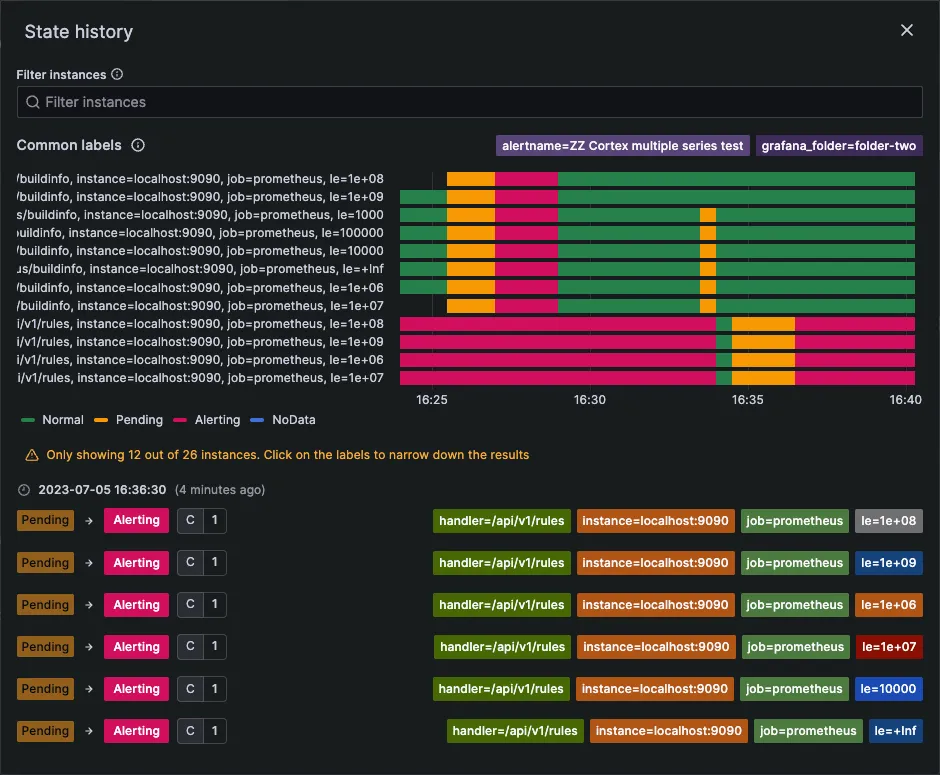
Grafana’s alerting system can trigger notifications when predefined thresholds are breached, ensuring rapid response to critical incidents.
Historical Analysis
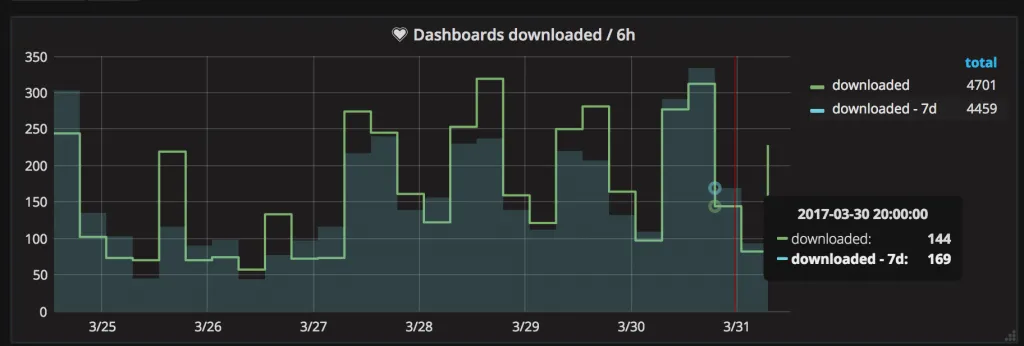
Engineers can delve into historical data to understand long-term trends, assess the impact of changes, and plan for capacity scaling.
In essence, Grafana serves as the glue that brings together the myriad data points generated by modern applications and infrastructure. It provides engineers with the tools they need to gain visibility into their systems, troubleshoot issues, and optimize performance.
The InRhythm Propel Summit: Fostering Innovation In DevOps
The InRhythm Propel Summit is a dynamic platform that brings together thought leaders, industry experts, and engineers to explore the latest trends, strategies, and technologies shaping the world of DevOps. Our mission is clear: to accelerate learning and growth, foster innovation, and empower engineering teams to thrive in a rapidly evolving technical landscape.
One of the standout events within the Propel Summit is our DevOps Workshop, a crucible of knowledge and collaboration. Led by Taufiqur Ashrafy, our DevOps Workshop delves into critical aspects of the DevOps methodology. It equips engineers with the tools and insights needed to streamline workflows, enhance collaboration between development and operations teams, and ultimately, deliver software more efficiently and reliably.
The Full Stack Observability programming within the Propel Summit is at the forefront of DevOps innovation. It’s here that engineers gain valuable insights into monitoring, troubleshooting, and optimizing their technology stacks. By adopting the latest observability practices, teams can detect issues faster, respond proactively to incidents, and ensure the highest levels of application performance and reliability.
As part of our unwavering commitment to support the learning and growth of engineering teams, the Propel Summit offers a unique opportunity to connect with industry peers, share knowledge, and explore the frontiers of technology. Join us in this exciting journey of discovery and innovation as we continue to push the boundaries of what’s possible in the world of software engineering.
Closing Thoughts
In an era marked by complex, distributed systems, Full Stack Observability is no longer a luxury but a necessity. It’s the compass that guides engineers through the intricate web of modern technology stacks, helping them uncover hidden issues, optimize performance, and deliver exceptional user experiences.
Grafana, with its versatility and integration capabilities, stands as a cornerstone in achieving Full Stack Observability. By leveraging Grafana and other observability tools, organizations can gain the insights needed to build resilient, high-performance systems that meet the demands of today’s digital world.
As we continue to explore emerging technologies and best practices through initiatives like the InRhythm Propel Summit, we invite you to join us on this journey of growth and innovation. Together, we can navigate the complexities of the tech landscape, unlock new possibilities, and push the boundaries of what’s possible in the world of software engineering.