
DevOps practices have become indispensable, bridging the gap between development and operations teams and ensuring the swift delivery of reliable software. Central to this transformative journey is the adoption of Full Stack Observability, a comprehensive approach to monitoring and troubleshooting that empowers engineers to maintain the performance and reliability of their applications.
At the heart of Full Stack Observability stands Prometheus, an open-source monitoring and alerting toolkit. Prometheus has emerged as a linchpin in the realm of DevOps, offering a robust, scalable, and highly flexible solution for gathering, storing, and analyzing time-series data. In this article, we’ll delve deep into Prometheus, demystifying its core functionalities, and exploring how it plays a pivotal role in supporting Full Stack Observability and enhancing DevOps workflows for developers.
Understanding Prometheus
Prometheus is an open-source monitoring and alerting system originally developed by SoundCloud. It has rapidly gained popularity in the DevOps community for its simplicity, reliability, and adaptability. At its core, Prometheus is designed to collect and store time-series data — information that evolves over time and is indexed by timestamps. This data often represents key metrics and events from various components of a software system, such as servers, applications, databases, and network devices.
Prometheus employs a pull-based architecture, where it periodically scrapes data from instrumented targets using HTTP endpoints. This approach allows Prometheus to be highly versatile, as it can monitor a wide range of systems and services, regardless of the underlying technology stack. Data collected by Prometheus is stored in a time-series database (TSDB), which makes it well-suited for analyzing historical performance and trend analysis.
The Role Of Prometheus In Full Stack Observability
Full Stack Observability is a holistic approach to understanding and optimizing the performance and reliability of modern software systems. It goes beyond traditional monitoring by encompassing various dimensions of observability, namely metrics, logs, and traces. Prometheus excels in the metrics dimension and serves as a cornerstone for achieving Full Stack Observability.
Metrics Collection And Storage
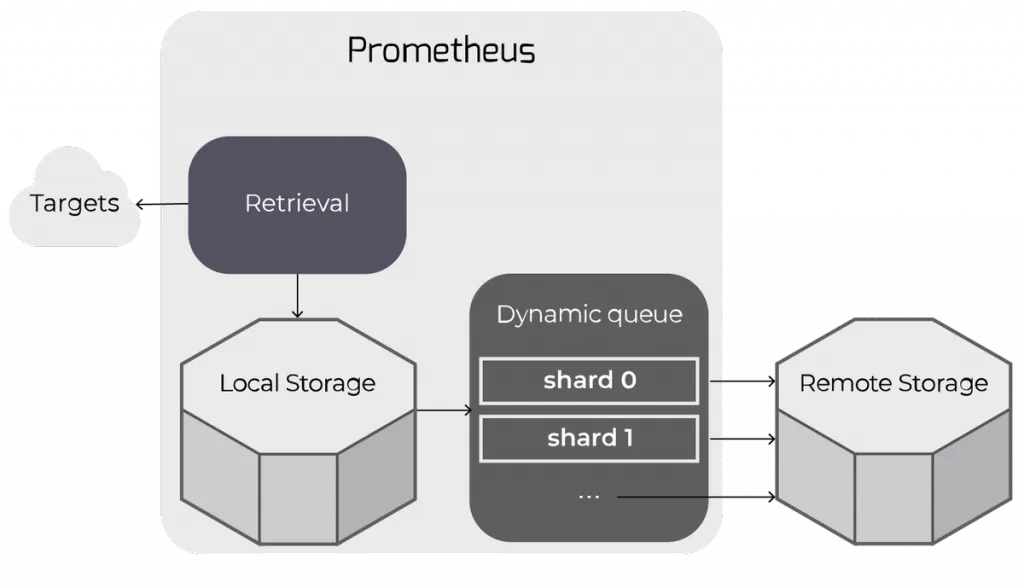
Prometheus is renowned for its ability to collect, store, and query time-series metrics efficiently. Engineers can instrument their applications and infrastructure with Prometheus libraries or exporters, which expose essential metrics for monitoring. Prometheus scrapes these metrics at regular intervals, storing them in its TSDB.
By providing detailed insights into system behavior, metrics enable engineers to pinpoint performance bottlenecks, troubleshoot issues, and optimize resource utilization. Prometheus makes it easy to define custom alerts and thresholds, enabling proactive incident response and automated remediation.
Service Discovery And Dynamic Configuration
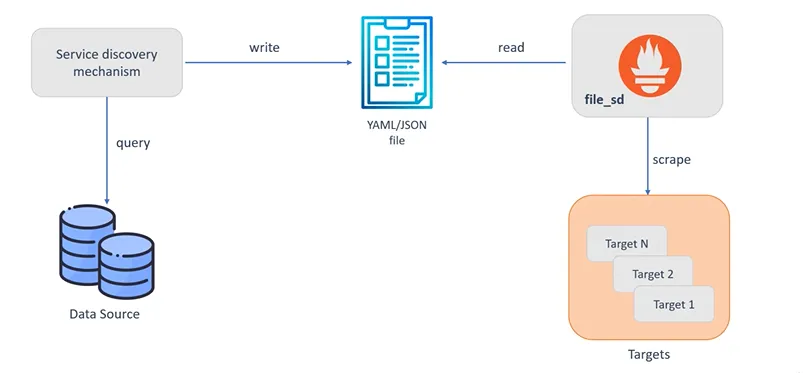
Maintaining a real-time inventory of targets to monitor can be challenging in dynamic, cloud-native environments. Prometheus offers robust service discovery mechanisms that automatically detect and monitor new instances as they come online. Whether you’re working with Kubernetes, Docker Swarm, or traditional virtual machines, Prometheus adapts to your infrastructure’s fluidity.
Data Visualization And Alerting
Prometheus’s power extends beyond data collection. It provides a straightforward querying language, PromQL, that enables engineers to express complex questions about their systems. This language facilitates advanced data analysis and visualization using tools like Grafana, helping teams gain valuable insights into system performance.
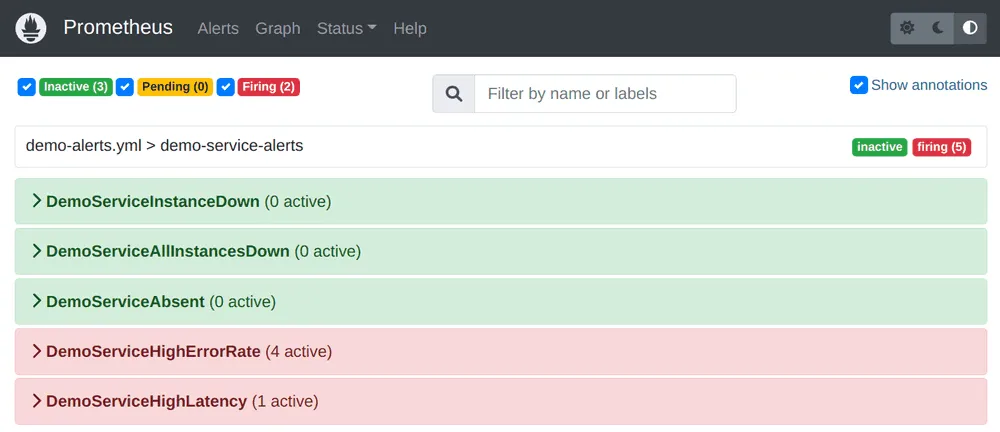
Moreover, Prometheus supports alerting rules, allowing engineers to define conditions for triggering alerts when certain thresholds are breached. This proactive approach to monitoring enables swift responses to anomalies and potential issues before they impact users.
Enhancing DevOps Workflows With Prometheus
In the context of DevOps, Prometheus plays a pivotal role in streamlining workflows and improving collaboration between development and operations teams. Here’s how:
- Fostering Collaboration: Prometheus provides a common language for both developers and operations teams. Developers can instrument their code with Prometheus metrics, gaining visibility into the performance of their applications in production. Operations teams can leverage Prometheus to monitor infrastructure and address issues promptly.
- Reducing Mean Time To Resolution (MTTR): By offering real-time insights into system behavior and alerting on anomalies, Prometheus helps reduce MTTR — a critical metric in incident response. When issues occur, teams can rapidly identify root causes, leading to faster problem resolution.
- Optimizing Resource Utilization: Understanding how your applications consume resources is essential for cost optimization in cloud environments. Prometheus’s detailed metrics enable teams to rightsize their infrastructure, ensuring that resources are neither over-provisioned nor underutilized.
- Scalability And Flexibility: Prometheus scales horizontally, making it adaptable to the needs of organizations of all sizes. Whether you’re monitoring a small application or a complex microservices architecture, Prometheus can accommodate your requirements.
The DevOps Workshop: A Key Component
As a key element of the InRhythm Propel Summit, the DevOps Workshop, led by industry expert Taufiqur Ashrafy, demonstrates the transformative potential of Full Stack Observability, a critical DevOps practice. This workshop empowers participants with the knowledge and skills needed to effectively implement Full Stack Observability in their organizations.
The workshop’s interactive format encourages collaboration and knowledge sharing among participants. It creates an environment where attendees not only gain insights from experts, like Taufiqur Ashrafy, but also learn from their peers. This collaborative spirit mirrors the Summit’s mission: to facilitate learning and growth by providing a platform for professionals to connect, share insights, and collectively enhance their understanding of cutting-edge technologies and practices.
Closing Thoughts
In the era of DevOps and Full Stack Observability, Prometheus stands out as a formidable ally for engineers and organizations seeking to maintain the highest levels of system performance and reliability. With its versatility, scalability, and rich set of features, Prometheus empowers teams to embrace a data-driven approach to monitoring and incident response.
As the cornerstone of Full Stack Observability, Prometheus exemplifies the philosophy of DevOps, fostering collaboration, accelerating incident response, and ensuring the seamless operation of modern software systems. By harnessing Prometheus’s capabilities, organizations can embark on a journey toward a more robust, efficient, and resilient technology stack, poised to meet the ever-evolving demands of the digital age.